Federal sub-agency · Department of Justice
U.S. Marshals Service
U.S. Marshals Service obligated $1.5B on federal contracts in FY2026 across 9,537 contract actions (+14% vs FY2025). Its largest recipient was METROPOLITAN SECURITY SERVICES, INC. ($506.9M).
- Obligations · FY2026
- $1.5B
- Actions
- 9,537
- New awards: 2,371
- Sole-source
- 5.5%
- Small business
- 24%
Spending by fiscal year
Obligations per federal fiscal year (October–September).
- 890.6MFY2017
- 992.2MFY2018
- 1.1BFY2019
- 998.9MFY2020
- 1.1BFY2021
- 1.2BFY2022
- 1.3BFY2023
- 1.3BFY2024
- 1.3BFY2025
- 1.5BFY2026
Top recipients
Obligations in FY2026.
- METROPOLITAN SECURITY SERVICES, INC.$506.9M34%
- THE GEO GROUP, INC.$155.5M11%
- HERITAGE HEALTH SOLUTIONS, INC.$109.8M7.4%
- CENTERRA GROUP, LLC$52.8M3.6%
- CORECIVIC, INC.$52.6M3.6%
- M. C. DEAN, INC.$47.1M3.2%
- GEO SECURE SERVICES, LLC$36.8M2.5%
- AERSALE, INC.$35M2.4%
- MAYVIN, INC.$31.7M2.1%
What was bought · Where the work was performed
Obligations in FY2026.
What was bought
- Facilities & utilities$784.8M53%
- Professional services$211.4M14%
- Other equipment & supplies$168.6M11%
- Health & medical$110.9M7.5%
- IT & telecom$103.8M7.0%
- Weapons, aircraft, ships & vehicles$63.2M4.3%
- Equipment maintenance$17.6M1.2%
- Transportation & logistics$12.2M0.8%
- Education & social services$3.3M0.2%
- Construction & real property$1.2M0.1%
- Research & development$646.1K0.0%
Where the work was performed
- Tennessee$541.9M37%
- Virginia$283.3M19%
- Texas$188.7M13%
- Florida$171.6M12%
- California$52.4M3.5%
- Georgia$40.1M2.7%
- District of Columbia$23.5M1.6%
- Maryland$22.4M1.5%
- Missouri$17.3M1.2%
- Arizona$16.6M1.1%
Integrity signals
Shares of the year's obligations, next to the country's.
- Low competition19%US 39% · $275.5M
- Sole-source awards5.5%US 30% · $81.6M
- Single-offer competitions13%US 8.8% · $193.9M
- Urgency justifications0.7%US 5.1% · $10.8M
- Year-end rush9.9%US 5.6% · $146.5M
- Undefinitized contracts0.3%US 5.0% · $4.8M
- Time-and-materials pricing53%US 4.2% · $778.6M
A signal is a reason to look closer, not evidence of wrongdoing: most sole-source awards are lawful and justified.
Offices with the most sole-source money
- PROCUREMENT DIVISION, OSS$31.9M12%
- U.S. DEPT OF JUSTICE, USMS$14.3M3.6%
- U.S. DEPT OF JUSTICE, USMS$10.3M28%
- PROCUREMENT DIVISION, APC$9.7M17%
- PROCUREMENT DIVISION, ISB$6.7M16%
Contracts terminated for default: 2
Largest awards
- THE GEO GROUP, INC.· Webb County, TX· Professional services· Oct 21, 2016 – Sep 21, 2026· DJJODT7C0003
- DETENTION SERVICES$568.1MTHE GEO GROUP, INC.· DeKalb County, GA· Professional services· Oct 27, 2016 – Sep 28, 2026· DJJODT8C0005
- HERITAGE HEALTH SOLUTIONS, INC.· Dallas County, TX· Health & medical· Oct 31, 2024 – Jan 13, 2026· 15M40025FA3500010
- HERITAGE HEALTH SOLUTIONS, INC.· Dallas County, TX· Health & medical· Sep 23, 2025 – Sep 18, 2026· 15M40025FA3500031
- BAE SYSTEMS TECHNOLOGY SOLUTIONS & SERVICES INC.· Montgomery County, MD· IT & telecom· Aug 15, 2024 – Aug 19, 2026· 15M10424FA4700033
- THE GEO GROUP, INC.· Palm Beach County, FL· Facilities & utilities· Sep 29, 2023 – Jul 28, 2026· 15M40023FA3500005
- GEO SECURE SERVICES, LLC· Palm Beach County, FL· Facilities & utilities· Dec 22, 2023 – Jun 2, 2026· 15M40024FA3500002
Subawards under this agency's awards
First-tier subawards that recipients of this agency's contracts and financial assistance reported, by the fiscal year of the subaward.
FY2026
- Sub-contracts: $10.5M (83 subawards)
36 sub-recipients
Largest sub-recipients
- CENTRE LAW AND CONSULTING, LLC$1.5M14%MCLEAN, VA · 1 subaward
- AMAZON WEB SERVICES, INC.$1.2M11%SEATTLE, WA · 4 subawards
- IQSIGHT LLC$1.1M11%FAIRPORT, NY · 7 subawards
- IDENTIV, INC.$657.9K6.3%FREMONT, CA · 8 subawards
- HIRSCH SECURE INC.$458.5K4.4%SANTA ANA, CA · 7 subawards
- INTEGRITY SIG LLC$450.9K4.3%CLINTON TOWNSHIP, MI · 1 subaward
- I5 SHAREPOINT CONSULTING, LLC$426K4.1%BOWIE, MD · 3 subawards
- VIRTUAL WORKGROUP TECHNOLOGIES CORP$418K4.0%GERMANTOWN, MD · 4 subawards
- SEIGEL COMMUNICATIONS SERVICE LLC$415.1K4.0%MOORHEAD, MN · 1 subaward
- ARTHUR GRAND TECHNOLOGIES INC$390.6K3.7%ASHBURN, VA · 1 subaward
Primes report first-tier subawards of $30,000 or more themselves, and many go unreported (GAO-24-106214). Reporting moved from FSRS to SAM.gov in March 2025 and fewer sub-contracts have been reported since. Amounts are what primes reported; they are never added to prime award totals.
Source: Subawards (first-tier sub-contracts and sub-grants reported under FFATA) (U.S. Department of the Treasury, USAspending.gov (reports filed in SAM.gov, formerly FSRS)), data current to Oct 8, 2026, loaded Oct 8, 2026 · Subawards loaded from FY2021.
Who lobbies this agency
Organizations whose quarterly lobbying reports list this agency as contacted, ranked by the reports' spending. A report's amount covers all its issues and every agency it lists; reports do not split it.
- Lobbying in 2026
- $60K
- Clients
- 1
- Reports
- 1
The whole amount of every report that lists this agency.
Organizations lobbying it, 2026
- 11% of its family's FY2026 contracts from this agency · Defense, Homeland security
Lobbying amounts are the filers' own good-faith estimates on quarterly LD-2 reports (the law asks for amounts rounded to $10,000; under $5,000 need not be itemized), latest amendment only. When an organization files its own report, it replaces what outside firms report for it that quarter. Matches are by name. Lobbying and political giving are legal and public: they show engagement with government, not influence over any award. Correlation is not influence: these organizations' lobbying and their contracts are shown side by side, and nothing here implies either affected the other.
Source: Lobbying disclosures (LD-1 registrations, LD-2 quarterly reports, LD-203 contribution reports) (Clerk of the U.S. House of Representatives), data current to Oct 7, 2026, loaded Oct 7, 2026 · 2023–2026.
Source: Committees, candidates and committee contributions to candidates (Federal Election Commission), data current to Oct 8, 2026, loaded Oct 8, 2026 · 2026, 2024, 2022.
Matches: Analisa AI name judgments (entity-match@1), updated Sep 30, 2026.
Committees that oversee and fund it
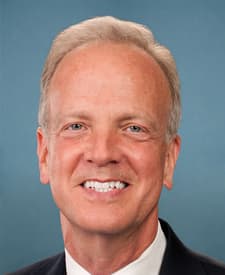
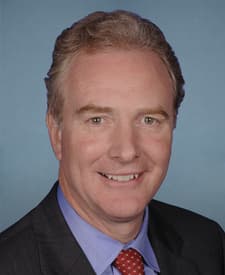
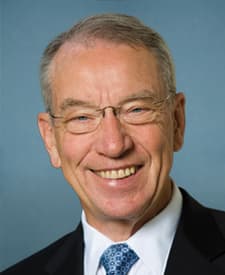
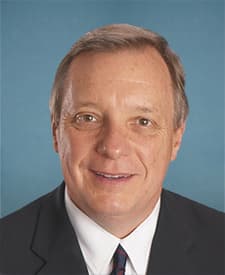
Congressional committees whose jurisdiction includes this agency, and the appropriations subcommittees that write its spending bill (Analisa's reading of the House and Senate rules; committees share jurisdiction). Leaders as currently published.
…
Source: Federal contract transactions (Federal Procurement Data System) (U.S. Department of the Treasury, USAspending.gov), data current to Oct 7, 2026, loaded Oct 7, 2026.