U.S. Senate · Nov 3, 2026
Georgia · Senate
The count of the Nov 3, 2026 election as Georgia publishes it, the candidates' money side by side with their votes, the seat's earlier elections, and the place it represents.
Results
Georgia's count, unofficial. Votes for every candidate on the ballot, write-ins together.
- Jon OssoffDIncumbentLeads59.0% 2,469,059
- Mike CollinsR41.0% 1,713,673
- Ahead by 755,386 votes (18.1%)
- 159 of 159 reporting units counted
- Same party as the member who held the seat.
- Jon Ossoff: $115.9M · $46.94 raised per vote
- Mike Collins: $10.7M · $6.24 raised per vote
By county
Votes in each county of the contest, largest first; the bar shows the two-party margin. Overall: D +18.
- Fulton County457,674D +59
- Gwinnett County344,108D +43
- Cobb County336,154D +34
- DeKalb County322,074D +77
- Cherokee County126,616R +21
- Chatham County111,913D +35
- Henry County109,631D +52
- Forsyth County107,116R +11
- Clayton County95,877D +83
- Hall County78,603R +21
- Paulding County74,545R +0.3
- Columbia County67,618R +7.1
All 159 counties
- Coweta County66,737R +16
- Richmond County66,628D +52
- Houston County64,918D +8.8
- Muscogee County62,344D +40
- Fayette County62,259D +14
- Douglas County59,436D +53
- Bibb County55,298D +37
- Newton County47,715D +37
- Carroll County44,883R +21
- Walton County44,505R +27
- Clarke County42,723D +57
- Bartow County42,187R +29
- Rockdale County38,797D +65
- Jackson County35,876R +34
- Lowndes County35,631D +0.3
- Glynn County33,483R +12
- Barrow County32,825R +14
- Floyd County32,257R +20
- Whitfield County29,852R +13
- Dougherty County27,247D +53
- Spalding County25,579D +3.3
- Effingham County25,435R +30
- Bulloch County24,637R +10
- Catoosa County23,715R +37
- Troup County23,170R +5.2
- Oconee County22,592R +22
- Walker County21,349R +40
- Camden County19,015R +20
- Gordon County18,883R +41
- Laurens County18,084R +19
- Bryan County18,022R +14
- Habersham County17,420R +49
- Harris County17,182R +32
- Liberty County16,922D +39
- Thomas County16,837R +11
- Pickens County15,267R +51
- Baldwin County15,070D +12
- Dawson County14,374R +50
- Union County14,258R +52
- Monroe County14,080R +34
- Gilmer County13,983R +48
- Lee County13,281R +25
- Tift County13,278R +17
- Polk County13,268R +41
- Lumpkin County12,885R +47
- White County12,560R +55
- Madison County12,442R +37
- Colquitt County12,425R +32
- Jones County11,951R +21
- Coffee County11,849R +24
- Fannin County11,606R +52
- Murray County11,322R +50
- Haralson County11,314R +61
- Greene County11,162R +22
- Hart County10,779R +43
- Peach County10,637D +12
- Putnam County10,618R +32
- Morgan County10,484R +33
- Ware County10,240R +31
- Wayne County9,777R +44
- Upson County9,742R +25
- Sumter County9,612D +15
- Butts County9,576R +29
- Stephens County9,299R +48
- Pike County9,084R +63
- Meriwether County8,991R +13
- Burke County8,671D +7.9
- Franklin County8,491R +61
- Decatur County8,480R +9.4
- McDuffie County8,271R +9.2
- Grady County7,987R +23
- Washington County7,887D +8.1
- Lamar County7,846R +30
- Toombs County7,745R +33
- Rabun County7,742R +42
- Emanuel County7,299R +31
- Banks County7,250R +64
- Towns County7,107R +51
- Chattooga County7,058R +46
- Elbert County7,051R +29
- Pierce County7,022R +69
- Jasper County6,865R +46
- Oglethorpe County6,805R +24
- Worth County6,771R +37
- Mitchell County6,698R +2.6
- Crisp County6,292R +15
- Dodge County6,249R +36
- Tattnall County6,218R +36
- Appling County6,176R +50
- Jefferson County5,959D +10
- Berrien County5,818R +55
- McIntosh County5,698R +16
- Brantley County5,489R +72
- Cook County5,457R +28
- Brooks County5,454R +13
- Dade County5,389R +49
- Screven County5,204R +11
- Long County4,973R +1.3
- Ben Hill County4,885R +11
- Crawford County4,657R +36
- Bleckley County4,641R +42
- Heard County4,409R +58
- Jeff Davis County4,127R +51
- Wilkes County4,083R +3.6
- Lincoln County3,859R +34
- Macon County3,730D +28
- Wilkinson County3,695R +2.1
- Early County3,585R +3.2
- Bacon County3,516R +62
- Terrell County3,443D +12
- Hancock County3,395D +43
- Candler County3,392R +31
- Twiggs County3,358D +1.5
- Pulaski County3,333R +32
- Dooly County3,304D +3.1
- Irwin County3,272R +40
- Charlton County3,204R +45
- Telfair County3,152R +27
- Evans County3,112R +29
- Johnson County3,056R +38
- Taylor County2,990R +19
- Turner County2,968R +12
- Montgomery County2,950R +38
- Seminole County2,890R +29
- Marion County2,752R +13
- Talbot County2,723D +21
- Lanier County2,654R +30
- Jenkins County2,499R +15
- Wilcox County2,464R +41
- Randolph County2,354D +15
- Atkinson County2,234R +32
- Treutlen County2,233R +30
- Warren County2,078D +15
- Clinch County1,960R +41
- Miller County1,954R +43
- Wheeler County1,790R +35
- Schley County1,752R +52
- Calhoun County1,636D +22
- Stewart County1,426D +27
- Glascock County1,215R +75
- Baker County1,139R +9.4
- Clay County1,104D +15
- Chattahoochee County1,089D +5.6
- Webster County1,050R +9.7
- Echols County945R +67
- Quitman County868R +8.3
- Taliaferro County799D +23
Georgia requires a majority: if no candidate wins one on Election Day, the top two meet in a runoff on Dec 1, 2026.
Candidates and their money
Cumulative receipts reported to the FEC through each candidate's latest report. Shares are of receipts.
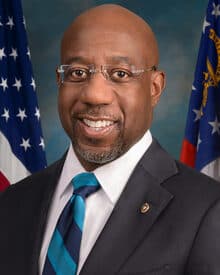
 T. Jonathan OssoffDemocratic · Incumbent$115.9MCash on hand $15.1M · through Oct 14, 2026From PACs of federal contractors: $42K
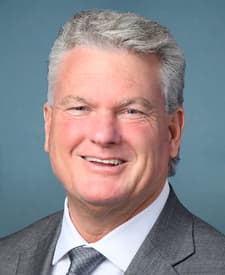 Michael A Collins JrRepublican · Challenger$10.7MCash on hand $1.1M · through Oct 14, 2026From PACs of federal contractors: $8,500
 Earl Leroy CarterRepublican · Challenger$7.3MCash on hand $58.6K · through Sep 30, 2026From PACs of federal contractors: $56.2K
- John KingRepublican · Challenger$563.1KCash on hand $0 · through Jan 31, 2026
- Jonathan McColumnRepublican · Challenger$36.1KCash on hand $12.4K · through Mar 31, 2026
Earlier elections for this seat
Certified results (FEC compilations from 2016, MIT Election Lab before). House districts are numbered seats whose lines change between plans.
- 2022—D +1.0
- 2022ʳRaphael WarnockD51.4%D +2.8
- 2020—R +1.8
- 2020ʳJon OssoffD50.6%D +1.2
- 2020ˢ—R +1.0
- 2020ʳRaphael WarnockD51.0%D +2.1
- 2016Johnny IsaksonR54.8%R +14
- 2014David A. PerdueR52.9%R +7.8
- 2010Johnny IsaksonR58.3%R +20
- 2008Saxby ChamblissR52.5%R +7.4
- 2004Johnny IsaksonR57.9%R +18
- 2002Saxby ChamblissR52.7%R +6.9
- 2000ˢZell MillerD58.5%D +21
- 1998Paul CoverdellR52.4%R +7.4
- 1996Max ClelandD48.9%D +1.4
- 1992Wyche Fowler Jr.D49.3%D +0.6
- 1990Sam NunnD100.0%D +100
- 1986Wyche Fowler Jr.D50.9%D +1.8
- 1984Sam NunnD79.9%D +60
- 1980Mack MattinglyR50.9%R +1.7
- 1978Sam NunnD83.1%D +66
Since the last election
Georgia before the 119th Congress took office (Jan 3, 2025) and the latest twelve months published, next to the nation. Comparisons, not causes.
- Population2024 → 2025+0.9%11,204,208 → 11,302,748U.S. +0.5%
- Unemployment rate2024 → 2025 · partial yearNo change3.4% → 3.4%U.S. +0.3 points
- New business applications2024 → 2025+3.8%21.7 /1k → 22.5 /1kU.S. +8%
- New homes permitted2024 → Oct 2025–Sep 2026 · preliminary−11%6.1 /1k → 5.4 /1kU.S. −4%
- Drug overdose deaths2024 → May 2025–Apr 2026 · provisional−24%17.5 /100k → 13.3 /100kU.S. −20%
- Violent crime rate2024 → 2025−7.1%320 /100k → 297 /100kU.S. −9.7%
The sitting member's record
Recorded votes in the current Congress. Activity measures are volume and attendance, not a grade.
- With party
- 95%
- 770/807
- Missed
- 5.5%
- 51/927
- Bills sponsored
- 24
- 0 became law
- Across the aisle
- 46%
- 111 of 242 bills cosponsored
- With party
- 94%
- 782/830
- Missed
- 2.8%
- 26/927
- Bills sponsored
- 29
- 0 became law
- Across the aisle
- 60%
- 225 of 375 bills cosponsored
How ballots were counted here
Mail and provisional ballots in recent federal general elections, as election offices reported them to the U.S. Election Assistance Commission. Pick the county you vote in.
Official election information
Registration, deadlines, polling places and your exact ballot come from your state election office.
Find yours on vote.govDistrict lines, money and the place's figures follow the lines this election is held on (the 120th Congress's, from the Census Bureau's block files).
- FEC bulk data: committee master, candidate master (candidates' names, no addresses), linkages, PAC summaries, all-candidates summaries and contributions from committees (no individual contributors) · Nov 20, 2026
- unitedstates/congress-legislators: legislators, committees and current committee membership · Oct 13, 2026
- Office of the Clerk, U.S. House of Representatives, roll-call vote records · Nov 20, 2026
- Lewis, Jeffrey B., Keith Poole, Howard Rosenthal, Adam Boche, Aaron Rudkin, and Luke Sonnet (2026). Voteview: Congressional Roll-Call Votes Database. https://voteview.com/ · Nov 20, 2026
- U.S. Census Bureau, Cartographic Boundary Files (congressional districts) and 2020 relationship files; 2026 lines (120th Congress): block equivalency files, TIGER/Line district shapes and 2020 Census block populations (DHC), combined by Analisa · Oct 16, 2026
- U.S. Census Bureau, 2020 relationship files (ZCTAs, tracts, blocks and congressional districts) and 120th Congress block equivalency files; shares computed by Analisa · Oct 13, 2026
- USAspending.gov, prime award contract transactions (FPDS) · Nov 20, 2026
- USAspending.gov, prime award financial assistance transactions (FABS) · Nov 20, 2026
- U.S. Census Bureau, Population Estimates Program · Sep 30, 2026
- U.S. Bureau of Labor Statistics, Local Area Unemployment Statistics · Sep 30, 2026
- U.S. Census Bureau, Business Formation Statistics (county business applications) · Oct 1, 2026
- U.S. Census Bureau, Building Permits Survey (county files) · Oct 29, 2026
- Centers for Disease Control and Prevention, National Center for Injury Prevention and Control, Mapping Injury, Overdose, and Violence (NVSS provisional and final mortality) · Nov 6, 2026
- FBI Uniform Crime Reporting Program, Crime Data Explorer (Return A master files and Crime in the United States estimates); New York City split by borough with NYPD complaint data and Chicago's violent crime since 2021 rebuilt from Chicago Police Department incident data (NYC Open Data, City of Chicago Data Portal); county aggregation by Analisa US. The FBI cautions against ranking places by crime counts alone. · Oct 1, 2026