U.S. House · Nov 3, 2026
North Dakota (at large)
The count of the Nov 3, 2026 election as North Dakota publishes it, the candidates' money side by side with their votes, the seat's earlier elections, and the place it represents.
Results
North Dakota's count, certified. Votes for every candidate on the ballot, write-ins together.
- Julie FedorchakRIncumbentWon57.3% 134,636
- Trygve HammerD36.6% 86,088
- Charles TuttleI4.0% 9,294
- Helene NevilleI2.0% 4,610
- Write-ins0.1% 342
- Ahead by 48,548 votes (20.7%)
- 358 of 358 reporting units counted
- Same party as the member who held the seat.
- Julie Fedorchak: $2.1M · $15.65 raised per vote
By county
Votes in each county of the contest, largest first; the bar shows the two-party margin. Overall: R +22.
- Cass County58,575D +6.4
- Burleigh County34,299R +28
- Grand Forks County19,644R +2.0
- Ward County16,401R +28
- Morton County10,142R +35
- Stark County8,163R +50
- Williams County6,636R +48
- Stutsman County6,245R +33
- Richland County5,342R +27
- McLean County3,759R +47
- Barnes County3,659R +26
- Ramsey County3,412R +33
All 53 counties
- Walsh County3,315R +39
- McKenzie County3,257R +58
- Mercer County3,212R +60
- Traill County3,009R +22
- Rolette County2,878D +44
- Mountrail County2,547R +29
- Bottineau County2,388R +42
- Pembina County2,276R +46
- McHenry County1,892R +41
- Dickey County1,772R +42
- Ransom County1,758R +11
- Dunn County1,553R +64
- Wells County1,530R +54
- LaMoure County1,480R +41
- Sargent County1,455R +22
- Cavalier County1,414R +41
- Pierce County1,402R +41
- Benson County1,295R +1.5
- Emmons County1,293R +70
- Bowman County1,258R +67
- Nelson County1,236R +17
- Foster County1,173R +52
- Kidder County1,052R +57
- Grant County1,026R +64
- McIntosh County1,025R +59
- Hettinger County1,015R +67
- Eddy County994R +40
- Divide County989R +48
- Griggs County896R +47
- Renville County869R +66
- Oliver County858R +60
- Towner County850R +41
- Adams County829R +53
- Logan County777R +71
- Steele County692R +17
- Burke County685R +65
- Golden Valley County677R +70
- Sioux County658D +41
- Sheridan County586R +70
- Billings County543R +64
- Slope County279R +78
Candidates and their money
Cumulative receipts reported to the FEC through each candidate's latest report. Shares are of receipts.
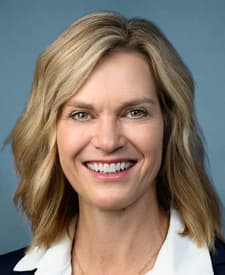 Julie FedorchakRepublican · Incumbent$2.1MCash on hand $774.8K · through Oct 14, 2026From PACs of federal contractors: $247.9K
- Trygve HammerDemocratic · Challenger$371KCash on hand $42.1K · through Oct 14, 2026
- Alex BalazsRepublican · Challenger$25.9KCash on hand $0 · through Jun 17, 2026
Earlier elections for this seat
Certified results (FEC compilations from 2016, MIT Election Lab before). House districts are numbered seats whose lines change between plans.
- 2022Kelly ArmstrongR62.2%lines cd118R +100
- 2020Kelly ArmstrongR69.0%lines cd116R +100
- 2018Kelly ArmstrongR60.2%lines cd116R +100
- 2016Kevin CramerR69.1%R +100
Since the last election
Before the 119th Congress took office (Jan 3, 2025) and the latest twelve months published, next to the nation. Estimates from the district's 53 counties, each weighted by the district's residents in it, on the lines this election is held on. Comparisons, not causes.
- Population2024 → 2025+0.8%793,387 → 799,358U.S. +0.5%
- Unemployment rate2024 → 2025 · partial year+0.2 points2.4% → 2.7%U.S. +0.3 points
- New business applications2024 → 2025+4.3%10.6 /1k → 11.1 /1kU.S. +8%
- New homes permitted2024 → Oct 2025–Sep 2026 · preliminary+13%2.9 /1k → 3.3 /1kU.S. −4%
- Drug overdose deaths2024 → May 2025–Apr 2026 · some counties have no figure · provisional+15%9.9 /100k → 11.4 /100kU.S. −20%
- Violent crime rate2024 → 2025 · some counties have no figure−11%252 /100k → 223 /100kU.S. −9.7%
The sitting member's record
Recorded votes in the current Congress. Activity measures are volume and attendance, not a grade.
- With party
- 100%
- 464/466
- Missed
- 2.0%
- 14/688
- Bills sponsored
- 17
- 1 became law
- Across the aisle
- 9%
- 13 of 144 bills cosponsored
Federal money in the district
Contracts performed within the district's lines, attributed by ZIP code and county.
Federal contracts in the district
- Centers for Medicare and Medicaid Services$334.6M · 40%
- Federal Aviation Administration$78.6M · 9.5%
- Department of the Army$68.9M · 8.3%
- Department of the Air Force$66.3M · 8.0%
Grants to the district's counties
The largest grant programs to the counties of the district, each county weighted by the district's share of its residents: an estimate. Grants to state governments are not included.
- surface transportation block grant program$154.9M
- fossil energy research and development$120.6M
- airport improvement program$63.6M
- national highway performance program (nhpp)$60.5M
- bridge formula program$44.4M
- highway planning and construction$40.8M
- national infrastructure investments$37.2M
- impact aid$35.9M
Direct payments and insurance (Social Security, Medicare, …): $98.9B (FY2026) · Their size follows who lives in the place (retirees, patients), not annual decisions.
How ballots were counted here
Mail and provisional ballots in recent federal general elections, as election offices reported them to the U.S. Election Assistance Commission. Pick the county you vote in.
Official election information
Registration, deadlines, polling places and your exact ballot come from your state election office.
Find yours on vote.govDistrict lines, money and the place's figures follow the lines this election is held on (the 120th Congress's, from the Census Bureau's block files).
- FEC bulk data: committee master, candidate master (candidates' names, no addresses), linkages, PAC summaries, all-candidates summaries and contributions from committees (no individual contributors) · Nov 21, 2026
- unitedstates/congress-legislators: legislators, committees and current committee membership · Oct 13, 2026
- Office of the Clerk, U.S. House of Representatives, roll-call vote records · Nov 20, 2026
- Lewis, Jeffrey B., Keith Poole, Howard Rosenthal, Adam Boche, Aaron Rudkin, and Luke Sonnet (2026). Voteview: Congressional Roll-Call Votes Database. https://voteview.com/ · Nov 21, 2026
- U.S. Census Bureau, Cartographic Boundary Files (congressional districts) and 2020 relationship files; 2026 lines (120th Congress): block equivalency files, TIGER/Line district shapes and 2020 Census block populations (DHC), combined by Analisa · Oct 16, 2026
- U.S. Census Bureau, 2020 relationship files (ZCTAs, tracts, blocks and congressional districts) and 120th Congress block equivalency files; shares computed by Analisa · Oct 13, 2026
- USAspending.gov, prime award contract transactions (FPDS) · Nov 21, 2026
- USAspending.gov, prime award financial assistance transactions (FABS) · Nov 21, 2026
- U.S. Census Bureau, Population Estimates Program · Sep 30, 2026
- U.S. Bureau of Labor Statistics, Local Area Unemployment Statistics · Sep 30, 2026
- U.S. Census Bureau, Business Formation Statistics (county business applications) · Oct 1, 2026
- U.S. Census Bureau, Building Permits Survey (county files) · Oct 29, 2026
- Centers for Disease Control and Prevention, National Center for Injury Prevention and Control, Mapping Injury, Overdose, and Violence (NVSS provisional and final mortality) · Nov 6, 2026
- FBI Uniform Crime Reporting Program, Crime Data Explorer (Return A master files and Crime in the United States estimates); New York City split by borough with NYPD complaint data and Chicago's violent crime since 2021 rebuilt from Chicago Police Department incident data (NYC Open Data, City of Chicago Data Portal); county aggregation by Analisa US. The FBI cautions against ranking places by crime counts alone. · Oct 1, 2026