U.S. Senate · Nov 3, 2026
Texas · Senate
The count of the Nov 3, 2026 election as Texas publishes it, the candidates' money side by side with their votes, the seat's earlier elections, and the place it represents.
Results
Texas's count, unofficial. Votes for every candidate on the ballot, write-ins together.
- James TalaricoDLeads55.1% 5,444,982
- Ken PaxtonR43.0% 4,249,373
- Ted BrownL1.9% 190,237
- Avery AyersO0.0% 1,925
- Jade SimmonsO0.0% 1,738
- Bradford "Brad" HallO0.0% 1,263
- Zul MohamedO0.0% 186
- Ahead by 1,195,609 votes (12.1%)
- 9,900 of 9,900 reporting units counted
- The leader is of another party than the member who held the seat (Republican).
- James Talarico: $146.3M · $26.88 raised per vote
- Ken Paxton: $22.3M · $5.25 raised per vote
- Ted Brown: $14.3K · $0.07 raised per vote
- Bradford "Brad" Hall: $5,430 · $4.30 raised per vote
By county
Votes in each county of the contest, largest first; the bar shows the two-party margin. Overall: D +12.
- Harris County1,383,480D +34
- Dallas County783,714D +46
- Tarrant County728,630D +20
- Bexar County658,445D +36
- Travis County548,782D +59
- Collin County457,641D +12
- Denton County396,235D +8.6
- Fort Bend County331,893D +29
- Williamson County278,668D +21
- Montgomery County258,542R +23
- El Paso County218,537D +49
- Hidalgo County202,572D +47
All 254 counties
- Brazoria County141,883D +5.5
- Galveston County134,598R +6.0
- Hays County119,756D +33
- Bell County110,646D +5.3
- Lubbock County104,334R +17
- Cameron County102,032D +39
- Nueces County99,319D +12
- Comal County89,143R +30
- Smith County89,051R +25
- Ellis County88,596R +4.5
- McLennan County83,167R +8.7
- Brazos County80,000D +6.1
- Parker County76,184R +52
- Jefferson County72,801D +13
- Guadalupe County70,982R +5.9
- Johnson County69,946R +28
- Kaufman County62,292D +1.3
- Webb County58,356D +49
- Grayson County53,814R +38
- Rockwall County53,506R +23
- Randall County53,226R +42
- Midland County44,041R +38
- Taylor County42,702R +32
- Gregg County38,059R +21
- Hunt County37,502R +35
- Bastrop County36,999D +11
- Tom Green County36,197R +28
- Wichita County34,359R +25
- Henderson County31,106R +47
- Wise County31,006R +53
- Hood County30,239R +53
- Ector County29,488R +19
- Victoria County28,167R +23
- Bowie County27,731R +33
- Angelina County27,286R +31
- Orange County26,305R +51
- Kendall County26,086R +44
- Potter County25,691R +20
- Liberty County25,483R +29
- Burnet County24,274R +40
- Harrison County24,056R +35
- Waller County23,759R +1.9
- Kerr County23,426R +38
- Van Zandt County22,175R +62
- Wilson County21,997R +36
- Walker County21,636R +20
- Nacogdoches County21,517R +13
- Medina County21,247R +22
- Hardin County20,933R +63
- San Patricio County20,116R +13
- Wood County19,769R +61
- Chambers County19,467R +47
- Coryell County18,856R +20
- Polk County17,507R +47
- Rusk County17,371R +41
- Cooke County17,148R +50
- Cherokee County16,611R +45
- Lamar County16,419R +47
- Navarro County16,108R +30
- Upshur County15,503R +57
- Washington County15,487R +42
- Anderson County15,290R +47
- Caldwell County14,781D +16
- Gillespie County14,588R +48
- Atascosa County14,563R +15
- Erath County14,118R +47
- Hopkins County13,287R +47
- Hill County13,178R +47
- Starr County13,082D +57
- Fannin County12,987R +53
- Brown County12,946R +63
- Austin County12,821R +47
- Maverick County12,596D +43
- Wharton County12,592R +35
- Jasper County11,992R +53
- Grimes County11,739R +45
- Llano County11,669R +51
- Val Verde County11,645D +13
- Fayette County11,186R +46
- Matagorda County10,937R +30
- Cass County10,836R +57
- Jim Wells County10,669D +16
- Aransas County10,599R +44
- San Jacinto County10,407R +51
- Palo Pinto County10,386R +50
- Bandera County10,234R +53
- Lampasas County9,165R +45
- Titus County8,751R +25
- Montague County8,637R +68
- Milam County8,608R +41
- Lavaca County8,588R +67
- Panola County8,568R +54
- Uvalde County8,360R +2.5
- Colorado County8,356R +44
- Kleberg County8,162D +15
- Burleson County7,804R +49
- Bosque County7,735R +54
- Blanco County7,566R +42
- Hale County7,541R +30
- Shelby County7,489R +48
- Houston County7,453R +47
- Freestone County7,307R +52
- Limestone County7,245R +37
- Tyler County7,216R +64
- Bee County7,159R +14
- Leon County7,062R +67
- Howard County7,054R +41
- Robertson County6,984R +34
- Lee County6,933R +43
- Gonzales County6,695R +32
- Young County6,578R +62
- Hockley County6,452R +47
- Calhoun County6,322R +33
- Eastland County6,322R +65
- DeWitt County6,251R +55
- Hutchinson County6,073R +62
- Trinity County5,754R +55
- Gray County5,499R +60
- Callahan County5,386R +67
- Jones County5,229R +58
- Comanche County5,150R +59
- Rains County5,080R +63
- Jackson County4,996R +55
- Falls County4,935R +29
- Gaines County4,786R +65
- Willacy County4,645D +36
- Clay County4,634R +70
- Somervell County4,307R +59
- Madison County4,298R +48
- Camp County4,285R +35
- Newton County4,272R +56
- Sabine County4,262R +71
- Red River County4,251R +49
- Franklin County4,245R +57
- Morris County4,205R +38
- Scurry County4,170R +60
- Andrews County4,148R +45
- Moore County4,114R +32
- Karnes County4,032R +39
- Archer County3,998R +71
- Live Oak County3,857R +59
- Marion County3,829R +43
- Brewster County3,811D +12
- Frio County3,798D +12
- Nolan County3,724R +41
- Hamilton County3,567R +60
- Deaf Smith County3,525R +15
- Jack County3,400R +71
- Wilbarger County3,390R +46
- Goliad County3,351R +48
- Pecos County3,340R +9.5
- Duval County3,280D +38
- Lamb County3,280R +46
- Zapata County3,255D +42
- Coleman County3,232R +71
- Runnels County3,169R +65
- Reeves County3,099D +8.0
- San Augustine County3,079R +41
- Zavala County3,078D +51
- Stephens County2,786R +66
- Dimmit County2,688D +40
- McCulloch County2,664R +63
- Terry County2,617R +44
- Dawson County2,574R +46
- Ward County2,555R +44
- Refugio County2,405R +25
- Carson County2,382R +70
- Ochiltree County2,332R +55
- San Saba County2,186R +66
- Mason County2,158R +54
- Mills County2,130R +67
- Lynn County2,123R +57
- Delta County2,001R +57
- Parmer County1,976R +46
- Kimble County1,971R +65
- Presidio County1,931D +56
- Mitchell County1,861R +62
- La Salle County1,858D +17
- Brooks County1,813D +41
- Yoakum County1,778R +39
- Swisher County1,714R +46
- Wheeler County1,693R +75
- Childress County1,685R +65
- Floyd County1,640R +42
- Haskell County1,623R +60
- Castro County1,542R +41
- Hartley County1,531R +70
- Hansford County1,509R +66
- Real County1,506R +58
- Crosby County1,490R +29
- Martin County1,478R +61
- Bailey County1,419R +35
- Fisher County1,413R +54
- Coke County1,354R +69
- Jim Hogg County1,351D +51
- Winkler County1,339R +40
- Shackelford County1,290R +77
- Donley County1,265R +68
- Hemphill County1,246R +58
- Kinney County1,229R +30
- Baylor County1,205R +68
- Garza County1,162R +57
- Sutton County1,092R +49
- Dallam County1,021R +51
- Crane County1,014R +41
- Jeff Davis County1,014R +5.0
- Knox County1,008R +52
- Concho County993R +60
- Crockett County991R +30
- Hardeman County974R +61
- Collingsworth County952R +69
- Lipscomb County933R +70
- Schleicher County915R +46
- Culberson County867D +23
- Armstrong County864R +79
- Upton County859R +56
- Hall County826R +63
- Edwards County805R +57
- Hudspeth County801R +16
- Menard County784R +52
- Dickens County749R +61
- Oldham County745R +73
- Sherman County705R +65
- Reagan County704R +40
- Cochran County694R +37
- Irion County643R +69
- Throckmorton County618R +73
- Briscoe County595R +71
- Glasscock County557R +80
- Cottle County535R +62
- Motley County516R +83
- Stonewall County510R +62
- Roberts County454R +86
- Sterling County449R +70
- Foard County407R +55
- McMullen County371R +74
- Kent County368R +65
- Terrell County339R +41
- Borden County307R +86
- Kenedy County160R +13
- King County116R +84
- Loving County67R +63
Candidates and their money
Cumulative receipts reported to the FEC through each candidate's latest report. Shares are of receipts.
- James TalaricoDemocratic · Challenger$146.3MCash on hand $9.9M · through Oct 14, 2026
- Warren Kenneth Paxton JrRepublican · Challenger$22.3MCash on hand $4.8M · through Oct 14, 2026From PACs of federal contractors: $24.5K
 Jasmine CrockettDemocratic · Challenger$11.1MCash on hand $0 · through Aug 13, 2026
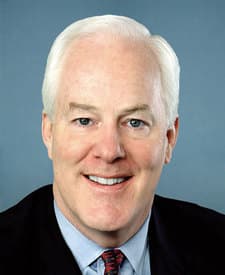 John CornynRepublican · Incumbent$8.6MCash on hand $496.1K · through Oct 14, 2026From PACs of federal contractors: $532.9K
- Colin AllredDemocratic · Challenger$7.6MCash on hand $402 · through Sep 30, 2026From PACs of federal contractors: $2,500
 Wesley HuntRepublican · Challenger$2.2MCash on hand $4,411 · through Sep 30, 2026
- Jade SimmonsIndependent · Challenger$27.7KCash on hand $1,436 · through Oct 14, 2026
- Theodore E. Brown JrLibertarian · Challenger$14.3KCash on hand $1,288 · through Oct 14, 2026
- Daniel M SimsLibertarian$11.7KCash on hand $200 · through May 19, 2026
- Gulrez KhanRepublican · Challenger$10.8KCash on hand -$646 · through Sep 30, 2026
- Virgil BierschwaleRepublican · Challenger$9,988Cash on hand $383 · through Mar 16, 2026
- Michael SwansonDemocratic · Challenger$6,991Cash on hand $0 · through Sep 30, 2025
- Bradford Winston HallW · Challenger$5,430Cash on hand $77.70 · through Oct 14, 2026
Earlier elections for this seat
Certified results (FEC compilations from 2016, MIT Election Lab before). House districts are numbered seats whose lines change between plans.
- 2024Ted CruzR53.1%R +8.7
- 2020John CornynR53.5%R +9.9
- 2018Ted CruzR50.9%R +2.6
- 2014John CornynR61.6%R +28
- 2012Ted CruzR56.5%R +16
- 2008John CornynR54.8%R +12
- 2006Kay Bailey HutchisonR61.7%R +26
- 2002John CornynR55.3%R +12
- 2000Kay Bailey HutchisonR65.1%R +34
- 1996Phil GrammR54.8%R +11
- 1994Kay Bailey HutchisonR60.8%R +23
- 1990Phil GrammR60.2%R +23
- 1988Lloyd BentsenD59.2%D +19
- 1984Phil GrammR58.5%R +17
- 1982Lloyd BentsenD58.6%D +18
- 1978John G. TowerR49.8%R +0.5
- 1976Lloyd BentsenD56.8%D +15
Since the last election
Texas before the 119th Congress took office (Jan 3, 2025) and the latest twelve months published, next to the nation. Comparisons, not causes.
- Population2024 → 2025+1.2%31,318,578 → 31,709,821U.S. +0.5%
- Unemployment rate2024 → 2025 · partial year+0.1 points4.1% → 4.2%U.S. +0.3 points
- New business applications2024 → 2025+9.5%15.7 /1k → 17.2 /1kU.S. +8%
- New homes permitted2024 → Oct 2025–Sep 2026 · preliminary−14%7.2 /1k → 6.2 /1kU.S. −4%
- Drug overdose deaths2024 → May 2025–Apr 2026 · provisional−12%15.2 /100k → 13.4 /100kU.S. −20%
- Violent crime rate2024 → 2025−13%395 /100k → 345 /100kU.S. −9.7%
The sitting member's record
Recorded votes in the current Congress. Activity measures are volume and attendance, not a grade.
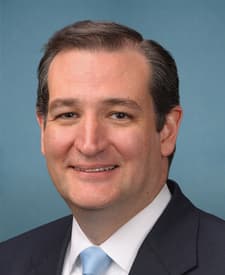
- With party
- 100%
- 821/822
- Missed
- 5.0%
- 47/938
- Bills sponsored
- 134
- 4 became law
- Across the aisle
- 15%
- 41 of 280 bills cosponsored
- With party
- 100%
- 841/841
- Missed
- 3.0%
- 28/938
- Bills sponsored
- 142
- 3 became law
- Across the aisle
- 26%
- 84 of 327 bills cosponsored
How ballots were counted here
Mail and provisional ballots in recent federal general elections, as election offices reported them to the U.S. Election Assistance Commission. Pick the county you vote in.
Official election information
Registration, deadlines, polling places and your exact ballot come from your state election office.
Find yours on vote.govDistrict lines, money and the place's figures follow the lines this election is held on (the 120th Congress's, from the Census Bureau's block files).
- FEC bulk data: committee master, candidate master (candidates' names, no addresses), linkages, PAC summaries, all-candidates summaries and contributions from committees (no individual contributors) · Nov 21, 2026
- unitedstates/congress-legislators: legislators, committees and current committee membership · Oct 13, 2026
- Office of the Clerk, U.S. House of Representatives, roll-call vote records · Nov 20, 2026
- Lewis, Jeffrey B., Keith Poole, Howard Rosenthal, Adam Boche, Aaron Rudkin, and Luke Sonnet (2026). Voteview: Congressional Roll-Call Votes Database. https://voteview.com/ · Nov 21, 2026
- U.S. Census Bureau, Cartographic Boundary Files (congressional districts) and 2020 relationship files; 2026 lines (120th Congress): block equivalency files, TIGER/Line district shapes and 2020 Census block populations (DHC), combined by Analisa · Oct 16, 2026
- U.S. Census Bureau, 2020 relationship files (ZCTAs, tracts, blocks and congressional districts) and 120th Congress block equivalency files; shares computed by Analisa · Oct 13, 2026
- USAspending.gov, prime award contract transactions (FPDS) · Nov 21, 2026
- USAspending.gov, prime award financial assistance transactions (FABS) · Nov 21, 2026
- U.S. Census Bureau, Population Estimates Program · Sep 30, 2026
- U.S. Bureau of Labor Statistics, Local Area Unemployment Statistics · Sep 30, 2026
- U.S. Census Bureau, Business Formation Statistics (county business applications) · Oct 1, 2026
- U.S. Census Bureau, Building Permits Survey (county files) · Oct 29, 2026
- Centers for Disease Control and Prevention, National Center for Injury Prevention and Control, Mapping Injury, Overdose, and Violence (NVSS provisional and final mortality) · Nov 6, 2026
- FBI Uniform Crime Reporting Program, Crime Data Explorer (Return A master files and Crime in the United States estimates); New York City split by borough with NYPD complaint data and Chicago's violent crime since 2021 rebuilt from Chicago Police Department incident data (NYC Open Data, City of Chicago Data Portal); county aggregation by Analisa US. The FBI cautions against ranking places by crime counts alone. · Oct 1, 2026