Federal sub-agency · Department of Homeland Security
Countering Weapons of Mass Destruction
No contract obligations recorded for Countering Weapons of Mass Destruction in FY2026. It also awarded $8.6M in federal grants and other assistance in FY2026.
- Obligations · FY2026
- $0
- Actions
- 0
- New awards: 0
- Sole-source
- —
- Small business
- —
Spending by fiscal year
Obligations per federal fiscal year (October–September).
Top recipients
Obligations in FY2026.
No contract obligations recorded for Countering Weapons of Mass Destruction in FY2026.
What was bought · Where the work was performed
Obligations in FY2026.
What was bought
Where the work was performed
Integrity signals
Shares of the year's obligations, next to the country's.
Federal grants & assistance awarded
Grants, loans (counted at their subsidy cost), direct payments and insurance, by fiscal year of the action (USAspending.gov, FABS). Reported apart from contracts and never added to them.
Countering Weapons of Mass Destruction obligated $8.6M in federal assistance in FY2026, on 20 actions (0 new awards), +471% vs FY2025. Its largest program was 97.091 · Homeland Security Biowatch Program ($8.1M).
- Assistance · FY2026
- $8.6M
- New awards
- 0
- Actions
- 20
- Since FY2021
- $223.1M
Assistance by fiscal year
- 67.2MFY2021
- 56.1MFY2022
- 33.3MFY2023
- 56.5MFY2024
- 1.5MFY2025
- 8.6MFY2026
By type
- Grants$8.6M100%
Top programs
- 97.091 · Homeland Security Biowatch Program$8.1M95%
- 97.106 · Securing the Cities Program$433.7K5.1%
Top recipients (organizations)
- CITY OF ATLANTA$433.7K5.1%ATLANTA, GA
- UNIVERSITY OF TENNESSEE$00.0%KNOXVILLE, TN
- LAS VEGAS, NV
- ATLANTA, GA
Where it went
- Washington$1.5M17%
- Maryland$1.3M16%
- Pennsylvania$1.1M13%
- Nevada$1.1M13%
- Georgia$841.6K9.8%
- Florida$727.7K8.5%
- Illinois$460.4K5.4%
- Indiana$394.9K4.6%
- Ohio$391.1K4.6%
- Colorado$336K3.9%
By state of the place of performance.
Source: Federal financial assistance transactions (Financial Assistance Broker Submission) (U.S. Department of the Treasury, USAspending.gov), data current to Oct 10, 2026, loaded Oct 10, 2026 · FY2021–FY2026.
Federal grants & assistanceSubawards under this agency's awards
First-tier subawards that recipients of this agency's contracts and financial assistance reported, by the fiscal year of the subaward.
FY2026
- Sub-grants: $50K (1 subaward)
1 sub-recipient
Largest sub-recipients
- SEATTLE, CITY OF$50K100%SEATTLE, WA · 1 subaward
Primes report first-tier subawards of $30,000 or more themselves, and many go unreported (GAO-24-106214). Reporting moved from FSRS to SAM.gov in March 2025 and fewer sub-contracts have been reported since. Amounts are what primes reported; they are never added to prime award totals.
Source: Subawards (first-tier sub-contracts and sub-grants reported under FFATA) (U.S. Department of the Treasury, USAspending.gov (reports filed in SAM.gov, formerly FSRS)), data current to Oct 10, 2026, loaded Oct 10, 2026 · Subawards loaded from FY2021.
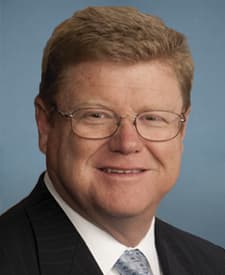
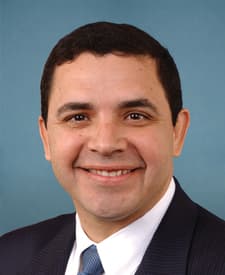
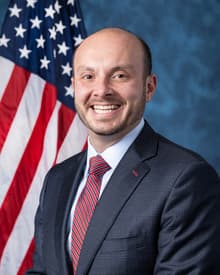
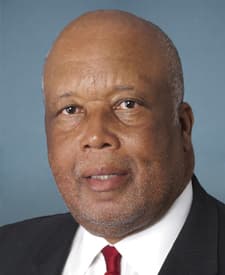
Committees that oversee and fund it
Congressional committees whose jurisdiction includes this agency, and the appropriations subcommittees that write its spending bill (Analisa's reading of the House and Senate rules; committees share jurisdiction). Leaders as currently published.
…
Source: Federal contract transactions (Federal Procurement Data System) (U.S. Department of the Treasury, USAspending.gov), data current to Oct 10, 2026, loaded Oct 10, 2026.