City · Fort Bend County, Texas
Sugar Land, Texas
Sugar Land is a city in Fort Bend County, Texas, part of the Houston-Pasadena-The Woodlands, TX metro area. It has 110,016 residents. Sugar Land, Texas has a quality-of-life score of 67 out of 100 (high), ranking #5,186 of 15,651 US cities and towns. Within Texas it ranks #50 of 1,016 cities and towns. It ranks best on math scores (high), injury deaths (low) and frequent mental distress (low). It ranks worst on public libraries (low), fine particulate matter (PM2.5) (high) and social associations (low).
- Quality-of-life score
- #5,186 of 15,651 cities and towns
- Texas
- #50 of 1,016 in TX
- Population
- 110,016 (2020-2024)
- Land area
- 40 mi²
- Density
- 2,717.8 /mi²
- FIPS code
- 4870808
Percentile-based score (100 is the best in the country) from 76 of 83 indicators, with the default “Explorer” weights.
Scores by category
Each category averages its indicators' percentile scores among US cities and towns.
- Safety75#3,821/15,639
- Economy94#934/15,631
- Housing36#9,529/14,977
- Health97#516/15,609
- Healthcare64#5,676/15,650
- Environment4#14,765/15,453
- Education89#1,719/15,650
- Infrastructure81#2,951/15,651
- Community29#11,163/15,651
- Leisure & amenities14#13,523/15,651
- Nature & outdoors—
Strengths · Weaknesses
Indicators where Sugar Land, Texas ranks highest and lowest among US cities and towns (score = percentile, 100 = best). Values marked “Fort Bend County value” are the county’s: the source publishes no figure for this city or town, and the county holding most of its residents stands in.
Strengths
- Math scores · high3.5798/100Texas 3.15United States 3.032019University of Wisconsin Population Health InstituteFort Bend County value
- Injury deaths · low46 /100k98/100Texas 69 /100kUnited States 87 /100k2019-2023University of Wisconsin Population Health InstituteFort Bend County value
- Frequent mental distress · low13.3%97/100Texas 18.5%United States 18.6%2023University of Wisconsin Population Health InstituteModel-based estimate
- Child care net cost · low18.2%97/100Texas 24.5%United States 27.9%2023 & 2024University of Wisconsin Population Health InstituteFort Bend County value
- Traffic deaths · low4.6 /100k97/100Texas 14.1 /100kUnited States 12.3 /100k2020-2024National Highway Traffic Safety AdministrationProvisional dataFort Bend County value
- Adult obesity · low24.2%95/100Texas 37.5%United States 38.2%2023University of Wisconsin Population Health InstituteModel-based estimate
Weaknesses
- Public libraries · low0.2 /10k2/100Texas 0.3 /10kUnited States 0.5 /10k2024Institute of Museum and Library ServicesFort Bend County value
- Fine particulate matter (PM2.5) · high9.4 µg/m³5/100Texas 8.9 µg/m³United States 8.0 µg/m³2022Centers for Disease Control and Prevention · U.S. Environmental Protection AgencyFort Bend County value
- Social associations · low4.8 /10k6/100Texas 7.3 /10kUnited States 9.1 /10k2023University of Wisconsin Population Health InstituteFort Bend County value
- Hot days · high115 days6/100Texas 111 daysUnited States 42 days2016-2025NOAA National Centers for Environmental InformationFort Bend County value
- High ozone days · high6 days13/100Texas 7 daysUnited States 7 days2022Centers for Disease Control and Prevention · U.S. Environmental Protection AgencyFort Bend County value
- Effective property tax rate · high1.76%
Trends
The largest changes over about five years, next to the country's over the same periods.
- PopulationFalling
118,709 (2015-2019) → 110,016 (2020-2024)
−7.3%5 yearsCensus table B01003US 328,329,953 → 340,003,797
- New homes permittedImproving
1.4 /1k (2021) → 3.7 /1k (Oct 2025–Sep 2026)
+169%5 yearsUS 5.2 /1k → 4.2 /1k
- Rent-burdened householdsWorsening
40.1% (2015-2019) → 51.6% (2020-2024)
+11 pts5 yearsCensus table B25070US 49.6% → 51.1%
- Rent as share of incomeWorsening
25.3% (2015-2019) → 30.9% (2020-2024)
+5.6 pts5 yearsCensus table B25071US 29.8% → 30.6%
- Home price to income ratioWorsening
2.7× (2015-2019) → 3.2× (2020-2024)
+18%5 yearsCensus table B25077US 3.5× → 4.1×
- Bachelor's degree or higherImproving
60.1% (2015-2019) → 63.0% (2020-2024)
+2.9 pts5 yearsCensus table B15003US 32.1% → 35.7%
What changed in five years
How each measure moved between two periods about five years apart, read against whether more or less is better, the published margin of error and the same change in other places.
Cities and towns like Sugar Land, Texas five years ago that improved
The places whose measures looked most like those of Sugar Land, Texas in the earlier period, ranked by how many measures improved beyond the margin of error, minus how many declined. A comparison of published data, not a forecast and not advice.
Who lives here
Age, race and education of residents, from the American Community Survey. Shares are of all residents (age), residents of every origin (race) or adults 25 and over (education).
Income
How household income is spread, not just the middle: each bar is the share of households in that income range.
Homes
Who owns and who rents, what homes cost, and what the housing stock looks like.
Getting to work
How workers travel to their job and how long it takes them.
Jobs and pay
What the largest occupations here pay, from the Bureau of Labor Statistics' Occupational Employment and Wage Statistics survey.
The Bureau of Labor Statistics publishes pay by metro area, not by county or city. The metro area page lists its largest occupations and lets you look up any job.
Pay in the Houston-Pasadena-The Woodlands, TXLocal businesses
Employer businesses and sole proprietors by industry, per resident and against the state and the nation. Counts of businesses next to counts of people, not a measure of demand.
Public schools
Public schools located in Sugar Land, Texas and the districts that run them (NCES Common Core of Data). Students per teacher counts full-time-equivalent teachers, not the size of each class.
Federal contracts performed here
Grants and other federal assistance are counted by county here, not split among cities: Sugar Land is mostly in Fort Bend County.
See federal money in Fort Bend CountyRepresentation in Congress
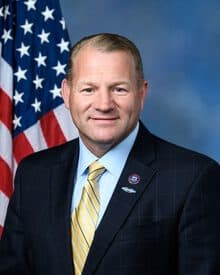
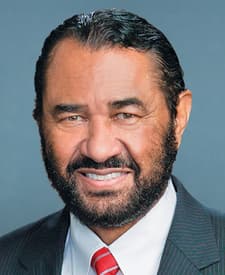
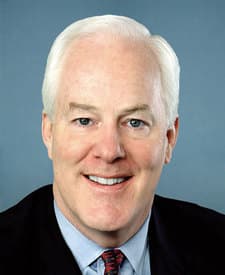
Members serving today, with their record in the current Congress (party-unity votes cast with their caucus, roll calls missed). Not a grade.
County
A city can lie in several counties. Some indicators are published for counties only: the page marks them.
Metro area
The metro or micro area the city belongs to.
Other cities and towns in Fort Bend County
Largest first.
Similar cities and towns
Closest indicator profiles across the country (no model: score distances).
- League City, TX45Alike on Population, Broadband subscribers, Poverty
- Friendswood, TX40Alike on Income per capita, Hills & mountains, Broadband subscribers
- Pecan Grove, TX68Alike on Broadband subscribers, Household income, Great Lakes
- Apollo Beach, FL56Alike on Broadband subscribers, Depression, Income per capita
- Pearland, TX48Alike on Hills & mountains, Population, Broadband subscribers
Data and sources
Latest published value of each indicator; periods differ by source. Values flagged by their publisher are marked.
- PLACES: Local Data for Better HealthCenters for Disease Control and Prevention · release 2025
- National Broadband Map (Broadband Data Collection)Federal Communications Commission · release 2026-06-30
- Local Area Unemployment StatisticsU.S. Bureau of Labor Statistics · release 2025
- American Community Survey 5-Year EstimatesU.S. Census Bureau · release 2017-2024
- Building Permits SurveyU.S. Census Bureau · release 2026-09
- Population Estimates ProgramU.S. Census Bureau · release 2025
- Small Area Health Insurance EstimatesU.S. Census Bureau · release 2024
- Small Area Income and Poverty EstimatesU.S. Census Bureau · release 2024
- County Health Rankings & RoadmapsUniversity of Wisconsin Population Health Institute · release 2022-2025+2026-03-supplement