Congressional district · Boundaries of the 119th Congress
Montana's 2nd district
Montana's 2nd district has 552,228 residents on 105,383 mi² of land. It is represented by Troy Downing (R-MT-2). Federal contract obligations attributed to it reached $540.3M in FY2026.
- Residents
- 552,228
- Land area
- 105,383 mi²
- Counties
- 41
- Representative
- Troy Downing
Members for this district
Members who held this seat while these boundaries were in force, newest first.
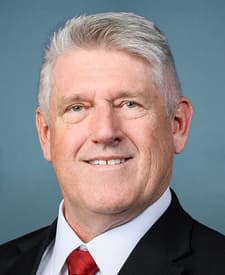
Senators
The state's senators today, or on the last day of these boundaries for an older plan.
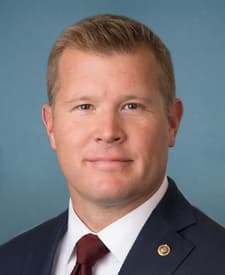 Tim SheehyR-MT
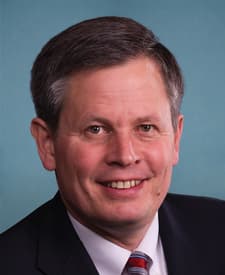 Steve DainesR-MT
Counties
Share of the district's residents living in each county, and share of the county's residents living in the district (2020 census tracts weighted by their overlap).
- Yellowstone County31% of the district · 100% of the county
- Cascade County15% of the district · 100% of the county
- Lewis and Clark County13% of the district · 100% of the county
- Park County3.2% of the district · 100% of the county
- Hill County2.9% of the district · 100% of the county
- Big Horn County2.3% of the district · 100% of the county
- Jefferson County2.3% of the district · 100% of the county
- Custer County2.2% of the district · 100% of the county
- Fergus County2.1% of the district · 100% of the county
- Richland County2.0% of the district · 100% of the county
- Carbon County2.0% of the district · 100% of the county
- Roosevelt County1.9% of the district · 100% of the county
- Stillwater County1.7% of the district · 100% of the county
- Dawson County1.6% of the district · 100% of the county
- Rosebud County1.5% of the district · 100% of the county
- Broadwater County1.4% of the district · 100% of the county
- Valley County1.4% of the district · 100% of the county
- Blaine County1.3% of the district · 100% of the county
- Teton County1.2% of the district · 100% of the county
- Chouteau County1.1% of the district · 100% of the county
- Musselshell County0.9% of the district · 100% of the county
- Toole County0.9% of the district · 100% of the county
- Phillips County0.8% of the district · 100% of the county
- Pondera County0.7% of the district · 66% of the county
- Sweet Grass County0.7% of the district · 100% of the county
- Sheridan County0.7% of the district · 100% of the county
- Fallon County0.5% of the district · 100% of the county
- Judith Basin County0.4% of the district · 100% of the county
- Wheatland County0.4% of the district · 100% of the county
- Meagher County0.4% of the district · 100% of the county
- Liberty County0.4% of the district · 100% of the county
- Powder River County0.3% of the district · 100% of the county
- McCone County0.3% of the district · 100% of the county
- Daniels County0.3% of the district · 100% of the county
- Carter County0.2% of the district · 100% of the county
- Prairie County0.2% of the district · 100% of the county
- Wibaux County0.2% of the district · 100% of the county
- Garfield County0.2% of the district · 100% of the county
- Golden Valley County0.2% of the district · 100% of the county
- Treasure County0.1% of the district · 100% of the county
- Petroleum County<0.1% of the district · 100% of the county
Federal contracts
Contract obligations attributed to the district by each action's county and its award's ZIP code (land shares through census tracts); an estimate where ZIP codes cross district lines.
- Obligations · FY2026
- $540.3M
- Per resident
- $978
- Rank in Montana
- 2 of 2
- Contract actions
- 4,890
- New awards: 3,048
By fiscal year
- 194.9MFY2017
- 281.8MFY2018
- 211.8MFY2019
- 295.2MFY2020
- 285.3MFY2021
- 341MFY2022
- 558.6MFY2023
- 507.2MFY2024
- 589.2MFY2025
- 540.3MFY2026
Top buyers
- Department of the Army$208.5M39%Department of Defense
- Forest Service$67.3M12%Department of Agriculture
- Federal Highway Administration$47.2M8.7%Department of Transportation
- Department of Veterans Affairs$29.5M5.5%
- Indian Health Service$25.8M4.8%Department of Health and Human Services
- Department of the Air Force$18.3M3.4%Department of Defense
- Federal Emergency Management Agency$17.5M3.2%Department of Homeland Security
- National Park Service$14.1M2.6%Department of the Interior
Top recipients
- ARCHER WESTERN FEDERAL JV$58.9M11%1 award
- PAF ELECTRICAL, INC.$57M11%1 award
- BILLINGS FLYING SERVICE LLC$32.8M6.1%41 awards
- ALEUT CONSTRUCTION LLC$26.4M4.9%1 award
- M.A. DEATLEY CONSTRUCTION, INC.$22.5M4.2%2 awards
- WESTON SOLUTIONS INC$21.7M4.0%1 award
- 2 awards
- KH CIVIL CONTRACTORS, INC.$13.1M2.4%3 awards
- HELICOPTER TRANSPORT SERVICES, LLC$12.4M2.3%1 award
- NEW FRONTIER AVIATION, LLC$11.6M2.1%4 awards
Other boundaries
District lines change between plans; each plan keeps its own page.
Sources and method
Every figure on this page traces to these records.
- Congressional district boundaries and relationship files (U.S. Census Bureau)U.S. Census Bureau, Cartographic Boundary Files (congressional districts) and 2020 relationship files · release cd116+cd118+cd119 · loaded Oct 3, 2026 · license: Public domain (U.S. Government work, 17 U.S.C. § 105)
- Members of Congress, their terms, committees and identifiers (The @unitedstates project (from the Biographical Directory of the U.S. Congress, the House and the Senate))unitedstates/congress-legislators: legislators, committees and current committee membership · data current to Oct 3, 2026 · loaded Oct 3, 2026 · license: CC0 1.0 (public domain dedication)
- ZIP code (ZCTA) to congressional district crosswalk (U.S. Census Bureau)U.S. Census Bureau, 2020 relationship files (ZCTAs, tracts and congressional districts); shares computed by Analisa · release 2020 · loaded Oct 3, 2026 · license: Public domain (U.S. Government work, 17 U.S.C. § 105)
- Federal contract transactions (Federal Procurement Data System) (U.S. Department of the Treasury, USAspending.gov)USAspending.gov, prime award contract transactions (FPDS) · data current to Oct 3, 2026 · loaded Oct 3, 2026 · license: Public domain (U.S. Government work, 17 U.S.C. § 105)
- Money and votes are shown side by side; neither explains the other.