Federal sub-agency · Department of the Interior
Departmental Offices
Departmental Offices obligated $2.4B on federal contracts in FY2026 across 7,295 contract actions (+7.9% vs FY2025). Its largest recipient was GENERAL DYNAMICS INFORMATION TECHNOLOGY, INC. ($235.5M). It also awarded $439.2M in federal grants and other assistance in FY2026.
- Obligations · FY2026
- $2.4B
- Actions
- 7,295
- New awards: 1,929
- Sole-source
- 15%
- Small business
- 55%
Spending by fiscal year
Obligations per federal fiscal year (October–September).
- 1.9BFY2017
- 1.6BFY2018
- 1.3BFY2019
- 1.5BFY2020
- 1.6BFY2021
- 2.3BFY2022
- 2.6BFY2023
- 3.4BFY2024
- 2.2BFY2025
- 2.4BFY2026
- 0FY2027
Top recipients
Obligations in FY2026.
- GUIDEHOUSE INC.$133M5.6%
- ACCENTURE FEDERAL SERVICES LLC$56.7M2.4%
- BELL TEXTRON INC$53.2M2.2%
- DEEP MILE NETWORKS LLC$52M2.2%
- MAGELLAN FEDERAL, INC.$47.8M2.0%
- BOOZ ALLEN HAMILTON INC$46.2M1.9%
- PLANET TECHNOLOGIES, INC.$36.7M1.5%
- SENECA STRATEGIC PARTNERS, LLC$33.4M1.4%
What was bought · Where the work was performed
Obligations in FY2026.
What was bought
- IT & telecom$1.1B46%
- Professional services$522.3M22%
- Facilities & utilities$232.7M9.8%
- Transportation & logistics$151.4M6.4%
- Research & development$103.8M4.4%
- Construction & real property$81.2M3.4%
- Weapons, aircraft, ships & vehicles$72.2M3.0%
- Equipment maintenance$60.8M2.6%
- Health & medical$23.6M1.0%
- Education & social services$20.2M0.9%
- Other equipment & supplies$13.9M0.6%
Where the work was performed
- Virginia$842.7M36%
- Maryland$418.8M18%
- District of Columbia$189.5M8.0%
- Colorado$114.7M4.8%
- Texas$102.6M4.3%
- California$81.7M3.4%
- Florida$74.6M3.1%
- Alaska$56.5M2.4%
- New York$46M1.9%
- Arizona$42.1M1.8%
Integrity signals
Shares of the year's obligations, next to the country's.
- Low competition39%US 39% · $922.3M
- Sole-source awards15%US 30% · $358.5M
- Single-offer competitions24%US 8.8% · $563.8M
- Urgency justifications1.6%US 5.1% · $39M
- Year-end rush20%US 5.6% · $472.1M
- Undefinitized contracts0.0%US 5.0% · $932.3K
- Time-and-materials pricing41%US 4.2% · $961.5M
A signal is a reason to look closer, not evidence of wrongdoing: most sole-source awards are lawful and justified.
Offices with the most sole-source money
- IBC ACQ SVCS DIRECTORATE (00004)$358.5M15%
Largest awards
- ACACIA CENTER FOR JUSTICE· District of Columbia, DC· Professional services· Mar 29, 2022 – Mar 23, 2026· 140D0422C0009
- GUIDEHOUSE INC.· Montgomery County, MD· Professional services· Sep 12, 2023 – Sep 24, 2026· 140D0423F0882
- ORR INFLUX CARE FACILITY$346.5MFAMILY ENDEAVORS, INC.· Reeves County, TX· Professional services· Nov 6, 2023 – Mar 26, 2026· 140D0424F0005
- EUESWS$334.9MDEEP MILE NETWORKS LLC· Fairfax County, VA· Professional services· Dec 1, 2022 – Sep 22, 2026· 140D0423F0030
- THE PROVIDENCIA GROUP LLC· Loudoun County, VA· Education & social services· Sep 19, 2022 – Jul 20, 2026· 140D0422C0037
- LUMEN TECHNOLOGIES GOVERNMENT SOLUTIONS, INC.· Arlington County, VA· IT & telecom· Sep 19, 2019 – Sep 23, 2026· 140D0419F0326
- IGF::CT::IGF$245MBOOZ ALLEN HAMILTON INC· Arlington County, VA· Professional services· Oct 28, 2016 – Apr 21, 2026· IND15PD01062
- PLANET TECHNOLOGIES, INC.· Montgomery County, MD· IT & telecom· Apr 18, 2019 – Jul 30, 2026· 140D0419F0183
Federal grants & assistance awarded
Grants, loans (counted at their subsidy cost), direct payments and insurance, by fiscal year of the action (USAspending.gov, FABS). Reported apart from contracts and never added to them.
Departmental Offices obligated $439.2M in federal assistance in FY2026, on 578 actions (147 new awards), −30% vs FY2025. Its largest program was 15.018 · Energy Community Revitalization Program (ECRP) ($315.9M).
- Assistance · FY2026
- $439.2M
- New awards
- 147
- Actions
- 578
- Since FY2021
- $2.6B
Assistance by fiscal year
- 41.2MFY2021
- 601.2MFY2022
- 96.4MFY2023
- 802.5MFY2024
- 625.9MFY2025
- 439.2MFY2026
By type
- Grants$439.2M100%
Top programs
- 15.018 · Energy Community Revitalization Program (ECRP)$315.9M72%
- 93.384 · Advanced Research Projects Agency for Health (Arpa-H)$79.5M18%
- 12.910 · Research and Technology Development$20.6M4.7%
- 15.427 · Federal Oil and Gas Royalty Management State and Tribal Coordination$12.7M2.9%
- 15.088 · Department of Interior Wildfire Management - Preparedness$4.6M1.0%
- 15.089 · Doi - Hq Experienced Services Program$1.9M0.4%
- 15.636 · Alaska Subsistence Management$1.6M0.4%
- 15.068 · H??ihi Grant Program$1.2M0.3%
Top recipients (organizations)
- HARRISBURG, PA
- COLORADO DEPARTMENT OF NATURAL RESOURCES$40.2M9.2%DENVER, CO
- MASSACHUSETTS INSTITUTE OF TECHNOLOGY$38.9M8.9%CAMBRIDGE, MA
- SANTA FE, NM
- BATON ROUGE, LA
- DEPARTMENT OF NATURAL RESOURCES$30M6.8%COLUMBUS, OH
- CHARLESTON, WV
- SACRAMENTO, CA
Where it went
- Pennsylvania$114.3M26%
- California$53.3M12%
- Colorado$43.1M9.8%
- Massachusetts$40M9.1%
- New Mexico$37M8.4%
- Louisiana$35.5M8.1%
- Ohio$30.4M6.9%
- West Virginia$29.2M6.7%
- New York$10.5M2.4%
- Utah$6.8M1.5%
By state of the place of performance.
Source: Federal financial assistance transactions (Financial Assistance Broker Submission) (U.S. Department of the Treasury, USAspending.gov), data current to Oct 8, 2026, loaded Oct 8, 2026 · FY2021–FY2026.
Federal grants & assistanceSubawards under this agency's awards
First-tier subawards that recipients of this agency's contracts and financial assistance reported, by the fiscal year of the subaward.
FY2026
- Sub-contracts: $242.9M (178 subawards)
- Sub-grants: $34M (50 subawards)
177 sub-recipients
Largest sub-recipients
- CERNER CORPORATION$55.9M20%KANSAS CITY, MO · 7 subawards
- ROCKITDATA LLC$25.9M9.3%RALEIGH, NC · 3 subawards
- S & P CONSULTANTS INC.$22.7M8.2%APOLLO BEACH, FL · 2 subawards
- ORACLE HEALTH GOVERNMENT SERVICES, INC.$22.6M8.2%KANSAS CITY, MO · 1 subaward
- TOEDT HEALTH SOLUTIONS, LLC$7.2M2.6%FRANKLIN, NC · 1 subaward
- RIA ADVISORY LLC$7.2M2.6%CORAL GABLES, FL · 2 subawards
- FEDERAL ERP, INC.$6.4M2.3%MINERAL, VA · 1 subaward
- CARAHSOFT TECHNOLOGY CORP$6.1M2.2%RESTON, VA · 8 subawards
- TYLER FEDERAL, LLC$5.5M2.0%HERNDON, VA · 1 subaward
- UKU BIO, INC.$4.6M1.7%ARLINGTON, MA · 1 subaward
Primes report first-tier subawards of $30,000 or more themselves, and many go unreported (GAO-24-106214). Reporting moved from FSRS to SAM.gov in March 2025 and fewer sub-contracts have been reported since. Amounts are what primes reported; they are never added to prime award totals.
Source: Subawards (first-tier sub-contracts and sub-grants reported under FFATA) (U.S. Department of the Treasury, USAspending.gov (reports filed in SAM.gov, formerly FSRS)), data current to Oct 8, 2026, loaded Oct 8, 2026 · Subawards loaded from FY2021.
Committees that oversee and fund it
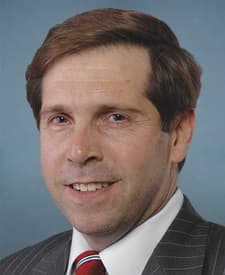
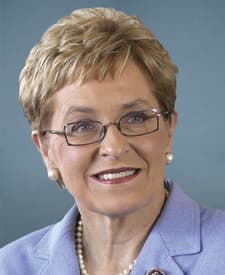
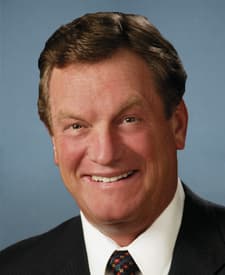
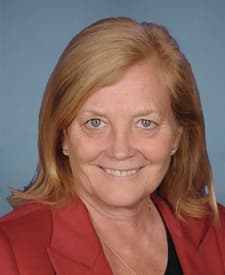
Congressional committees whose jurisdiction includes this agency, and the appropriations subcommittees that write its spending bill (Analisa's reading of the House and Senate rules; committees share jurisdiction). Leaders as currently published.
…
Source: Federal contract transactions (Federal Procurement Data System) (U.S. Department of the Treasury, USAspending.gov), data current to Oct 7, 2026, loaded Oct 7, 2026.