Federal sub-agency · Department of Transportation
Immediate Office of the Secretary of Transportation
Immediate Office of the Secretary of Transportation obligated $285.6M on federal contracts in FY2026 across 1,678 contract actions (+14% vs FY2025). Its largest recipient was WASHINGTON METROPOLITAN AREA TRANSIT AUTHORITY ($33.4M). It also awarded $834.6M in federal grants and other assistance in FY2026.
- Obligations · FY2026
- $285.6M
- Actions
- 1,678
- New awards: 350
- Sole-source
- 39%
- Small business
- 47%
Spending by fiscal year
Obligations per federal fiscal year (October–September).
- 380MFY2017
- 337.6MFY2018
- 271.2MFY2019
- 237.1MFY2020
- 201MFY2021
- 242.7MFY2022
- 228.2MFY2023
- 234.7MFY2024
- 249.7MFY2025
- 285.6MFY2026
- -27KFY2027
Top recipients
Obligations in FY2026.
- KBR WYLE SERVICES, LLC$27M9.4%
- SHIELDS POINT LLC$18.7M6.5%
- EMCOR GOVERNMENT SERVICES, INC$16.5M5.8%
- THE MITRE CORPORATION$10.2M3.6%
- KBR WYLE SERVICES, LLC$9.2M3.2%
- MACROSYS, LLC$8.6M3.0%
- FORENSIC DRUG & ALCOHOL TESTING LLC$8.6M3.0%
- GUIDEHOUSE INC.$8.1M2.8%
What was bought · Where the work was performed
Obligations in FY2026.
What was bought
- Professional services$112.7M39%
- IT & telecom$38.9M14%
- Transportation & logistics$33.6M12%
- Facilities & utilities$31.4M11%
- Construction & real property$20.9M7.3%
- Research & development$16.2M5.7%
- Other equipment & supplies$10.4M3.6%
- Equipment maintenance$9.6M3.4%
- Health & medical$9.5M3.3%
- Weapons, aircraft, ships & vehicles$1.3M0.4%
- Education & social services$1.1M0.4%
Where the work was performed
- District of Columbia$193.4M68%
- Massachusetts$54.7M19%
- Virginia$10.6M3.7%
- New York$5.3M1.9%
- California$5.3M1.9%
- Texas$4.4M1.5%
- New Hampshire$1.7M0.6%
- Alabama$1.5M0.5%
- Maryland$1.4M0.5%
- Michigan$1.3M0.5%
Integrity signals
Shares of the year's obligations, next to the country's.
- Low competition48%US 39% · $137.7M
- Sole-source awards39%US 30% · $110.5M
- Single-offer competitions9.5%US 8.7% · $27.2M
- Urgency justifications0.0%US 5.1% · $29.7K
- Year-end rush20%US 6.1% · $57.1M
- Undefinitized contracts0.0%US 5.0% · $0
- Time-and-materials pricing22%US 4.2% · $63.1M
A signal is a reason to look closer, not evidence of wrongdoing: most sole-source awards are lawful and justified.
Offices with the most sole-source money
- 693JK4 OST$98.5M50%
Largest awards
- WASHINGTON METROPOLITAN AREA TRANSIT AUTHORITY· District of Columbia, DC· Transportation & logistics· Nov 16, 2021 – Sep 21, 2026· 693JK422F9550005
- BERING STRAITS PROFESSIONAL SERVICES, LLC· District of Columbia, DC· Facilities & utilities· Oct 26, 2023 – Dec 3, 2025· 693JK424C500002
- SCIENCE APPLICATIONS INTERNATIONAL CORPORATION· District of Columbia, DC· Professional services· May 9, 2019 – Oct 16, 2025· DTRTVT2006
- SCIENCE APPLICATIONS INTERNATIONAL CORPORATION· Middlesex County, MA· IT & telecom· Sep 28, 2022 – Sep 28, 2026· 6913G622F50047N
- SHIELDS POINT LLC· District of Columbia, DC· Facilities & utilities· Dec 1, 2025 – Sep 11, 2026· 693JK426F65002N
- POTOMAC ELECTRIC POWER CO· District of Columbia, DC· Facilities & utilities· May 11, 2021 – Apr 22, 2026· 693JK421F5500006
- KPMG LLP· District of Columbia, DC· Professional services· Feb 8, 2021 – Jun 26, 2026· 693JK421F7500003
- SCIENCE APPLICATIONS INTERNATIONAL CORPORATION· District of Columbia, DC· Professional services· Dec 7, 2017 – Oct 7, 2025· 6913G618F400019
Federal grants & assistance awarded
Grants, loans (counted at their subsidy cost), direct payments and insurance, by fiscal year of the action (USAspending.gov, FABS). Reported apart from contracts and never added to them.
Immediate Office of the Secretary of Transportation obligated $834.6M in federal assistance in FY2026, on 1,880 actions (310 new awards), −6.8% vs FY2025. Its largest program was 20.901 · Payments for Essential Air Services ($680.5M).
- Assistance · FY2026
- $834.6M
- New awards
- 310
- Actions
- 1,880
- Since FY2021
- $4.6B
Assistance by fiscal year
- 808.9MFY2021
- 666.9MFY2022
- 673.9MFY2023
- 716.3MFY2024
- 895.8MFY2025
- 834.6MFY2026
By type
- Direct payments$680.5M82%
- Grants$154.2M18%
Top programs
- 20.901 · Payments for Essential Air Services$680.5M82%
- 20.943 · Rural and Tribal Assistance Pilot Program$54.2M6.5%
- 20.945 · Asset Concessions and Innovative Finance Assistance$41M4.9%
- 20.944 · Autonomous Vehicle Research in Rural Communities Program$25M3.0%
- 20.223 · Transportation Infrastructure Finance and Innovation Act (TIFIA) Program$11.8M1.4%
- 20.701 · University Transportation Centers Program$7.8M0.9%
- 20.950 · Bridge and Other Transportation Infrastructure Research Program$7M0.8%
- 20.941 · Strengthening Mobility and Revolutionizing Transportation (SMART) Grants Program$3.6M0.4%
Top recipients (organizations)
- SKYWEST AIRLINES INC$280.1M34%SAINT GEORGE, UT
- KEY LIME AIR CORPORATION$72.1M8.6%ENGLEWOOD, CO
- CORPORATE FLIGHT MANAGEMENT, INC.$65.8M7.9%SMYRNA, TN
- HYANNIS AIR SERVICE INC$47.8M5.7%HYANNIS, MA
- ALASKA AIRLINES, INC.$21.3M2.6%SEATTLE, WA
- SOUTHERN AIRWAYS EXPRESS LLC$20.2M2.4%FORT LAUDERDALE, FL
- GRANT AVIATION, INC$16.1M1.9%ANCHORAGE, AK
- ADVANCED AIR LLC$15.4M1.8%HAWTHORNE, CA
Source: Federal financial assistance transactions (Financial Assistance Broker Submission) (U.S. Department of the Treasury, USAspending.gov), data current to Oct 10, 2026, loaded Oct 10, 2026 · FY2021–FY2026.
Federal grants & assistanceSubawards under this agency's awards
First-tier subawards that recipients of this agency's contracts and financial assistance reported, by the fiscal year of the subaward.
FY2026
- Sub-contracts: $4.3M (62 subawards)
- Sub-grants: $33.9M (64 subawards)
71 sub-recipients
Largest sub-recipients
- SEATTLE, CITY OF$6.5M17%SEATTLE, WA · 1 subaward
- PURDUE UNIVERSITY$2.9M7.5%WEST LAFAYETTE, IN · 2 subawards
- UNIVERSITY OF CONNECTICUT$2.2M5.8%STORRS, CT · 1 subaward
- ROLLA, MO · 2 subawards
- MORGAN STATE UNIVERSITY$1.5M3.9%BALTIMORE, MD · 2 subawards
- UNIVERSITY OF ALABAMA$1.2M3.0%TUSCALOOSA, AL · 2 subawards
- UNIVERSITY OF SOUTHERN CALIFORNIA$1.1M2.8%LOS ANGELES, CA · 1 subaward
- SWIFTFORE, INC.$1.1M2.8%LAUREL, MD · 5 subawards
- RICHARDSON, TX · 1 subaward
- COLORADO STATE UNIVERSITY$904.3K2.4%FORT COLLINS, CO · 1 subaward
Primes report first-tier subawards of $30,000 or more themselves, and many go unreported (GAO-24-106214). Reporting moved from FSRS to SAM.gov in March 2025 and fewer sub-contracts have been reported since. Amounts are what primes reported; they are never added to prime award totals.
Source: Subawards (first-tier sub-contracts and sub-grants reported under FFATA) (U.S. Department of the Treasury, USAspending.gov (reports filed in SAM.gov, formerly FSRS)), data current to Oct 10, 2026, loaded Oct 10, 2026 · Subawards loaded from FY2021.
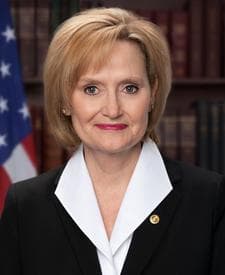
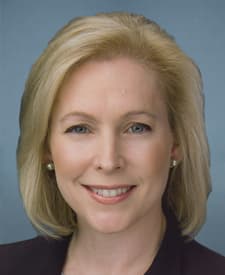
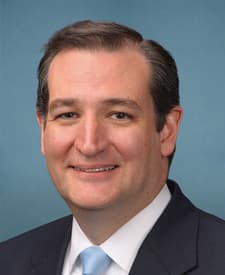
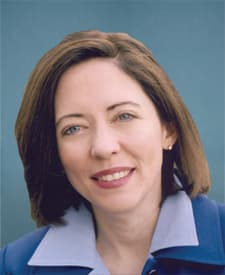
Committees that oversee and fund it
Congressional committees whose jurisdiction includes this agency, and the appropriations subcommittees that write its spending bill (Analisa's reading of the House and Senate rules; committees share jurisdiction). Leaders as currently published.
…
Source: Federal contract transactions (Federal Procurement Data System) (U.S. Department of the Treasury, USAspending.gov), data current to Oct 10, 2026, loaded Oct 10, 2026.