Federal sub-agency · Department of Agriculture
Agricultural Research Service
Agricultural Research Service obligated $380.3M on federal contracts in FY2026 across 3,220 contract actions (+9.5% vs FY2025). Its largest recipient was MERRICK & COMPANY ($33.8M). It also awarded $143.5M in federal grants and other assistance in FY2026.
- Obligations · FY2026
- $380.3M
- Actions
- 3,220
- New awards: 1,405
- Sole-source
- 15%
- Small business
- 72%
Spending by fiscal year
Obligations per federal fiscal year (October–September).
- 374.1MFY2017
- 256.5MFY2018
- 271.8MFY2019
- 430.5MFY2020
- 300.4MFY2021
- 333.6MFY2022
- 358.5MFY2023
- 366.8MFY2024
- 347.2MFY2025
- 380.3MFY2026
- -5.2KFY2027
Top recipients
Obligations in FY2026.
- MERRICK & COMPANY$33.8M8.9%
- MILL CREEK FIRELAKE JV LLC$24.9M6.6%
- COVINGTON FIRELAKE JV, LLC$24.9M6.5%
- CAS FSE JV II LLC$11.2M2.9%
- YOUR RECRUITING COMPANY, INC.$7.4M1.9%
- SH MECHANICAL INC.$7.3M1.9%
- PROCON INTERNATIONAL LLC$6.3M1.7%
- FIRELAKE CONSTRUCTION INC$5.8M1.5%
What was bought · Where the work was performed
Obligations in FY2026.
What was bought
- Construction & real property$141.6M37%
- Professional services$84.8M22%
- Other equipment & supplies$57.6M15%
- Equipment maintenance$46.8M12%
- Facilities & utilities$22.9M6.0%
- IT & telecom$17.8M4.7%
- Weapons, aircraft, ships & vehicles$4.8M1.3%
- Research & development$1.6M0.4%
- Transportation & logistics$991.7K0.3%
- Health & medical$825K0.2%
- Fuel$283.5K0.1%
- Education & social services$210.2K0.1%
Where the work was performed
- Kansas$89.6M24%
- Maryland$54.6M14%
- Louisiana$24.4M6.4%
- California$20.9M5.5%
- North Dakota$14.8M3.9%
- District of Columbia$13.7M3.6%
- Georgia$12.3M3.2%
- Oklahoma$11.5M3.0%
- Illinois$11.3M3.0%
- Iowa$11M2.9%
Integrity signals
Shares of the year's obligations, next to the country's.
- Low competition30%US 39% · $112.8M
- Sole-source awards15%US 30% · $55.7M
- Single-offer competitions15%US 8.7% · $57M
- Urgency justifications9.1%US 5.1% · $34.7M
- Year-end rush34%US 6.0% · $128.3M
- Undefinitized contracts5.3%US 5.0% · $20.2M
- Time-and-materials pricing1.4%US 4.2% · $5.1M
A signal is a reason to look closer, not evidence of wrongdoing: most sole-source awards are lawful and justified.
Offices with the most sole-source money
- USDA ARS AFM APD$56.1M15%
- USDA ARS PWA AAO ACQ/PER PROP$304.1K77%
- USDA ARS SEA AAO ACQ/PER PROP$72.2K0.0%
Contracts terminated for default: 3
Largest awards
- M. A. MORTENSON COMPANY· Clarke County, GA· Construction & real property· Jul 31, 2017 – Dec 5, 2025· AG3K25C170001
- MERRICK & COMPANY· Riley County, KS· Professional services· Aug 29, 2025 – Sep 25, 2026· 1232SA25C0028
- SECURITY GUARD SERVICES$25.2MDEFENSE CONTRACTING ACTIVITY, LLC· Riley County, KS· Facilities & utilities· Mar 4, 2021 – May 27, 2026· 12805B21F0011
- NBAF - BAS SUPPORT$20.1MMERRICK & COMPANY· Pottawatomie County, KS· Professional services· Feb 20, 2026 – Jul 8, 2026· 1232SA26C0001
- COVINGTON FIRELAKE JV, LLC· Terrebonne Parish, LA· Construction & real property· Sep 9, 2026 – Sep 9, 2026· 1232SA26C0016
- CPF LLC· Prince George's County, MD· Construction & real property· Mar 31, 2017 – Sep 28, 2026· AG32SCC160024
- JUSTIN J. REEVES, L.L.C· Terrebonne Parish, LA· Construction & real property· Aug 7, 2025 – Aug 10, 2026· 1232SA25C0020
Federal grants & assistance awarded
Grants, loans (counted at their subsidy cost), direct payments and insurance, by fiscal year of the action (USAspending.gov, FABS). Reported apart from contracts and never added to them.
Agricultural Research Service obligated $143.5M in federal assistance in FY2026, on 1,271 actions (339 new awards), −39% vs FY2025. Its largest program was 10.001 · Agricultural Research Basic and Applied Research ($143.5M).
- Assistance · FY2026
- $143.5M
- New awards
- 339
- Actions
- 1,271
- Since FY2021
- $1.5B
Assistance by fiscal year
- 251.9MFY2021
- 270.8MFY2022
- 319.6MFY2023
- 322.2MFY2024
- 233.6MFY2025
- 143.5MFY2026
By type
- Grants$78.9M55%
- Other assistance$64.7M45%
Top programs
- 10.001 · Agricultural Research Basic and Applied Research$143.5M100%
Top recipients (organizations)
- TEXAS A&M AGRILIFE RESEARCH$14.3M10.0%COLLEGE STATION, TX
- ARLINGTON, VA
- NORTH DAKOTA STATE UNIVERSITY$6.8M4.7%FARGO, ND
- LINCOLN, NE
- AUBURN UNIVERSITY$6.3M4.4%AUBURN, AL
- KANSAS STATE UNIVERSITY$5.7M3.9%MANHATTAN, KS
- BAYLOR COLLEGE OF MEDICINE$5.5M3.8%HOUSTON, TX
- UNIVERSITY OF CALIFORNIA, DAVIS$5.3M3.7%DAVIS, CA
Where it went
- Texas$22.4M16%
- Virginia$12.7M8.9%
- North Dakota$9.7M6.8%
- California$7.9M5.5%
- Alabama$7.1M5.0%
- Nebraska$6.6M4.6%
- Kansas$6M4.2%
- Wisconsin$5.8M4.0%
- Florida$5.6M3.9%
- Missouri$4.8M3.4%
By state of the place of performance.
Source: Federal financial assistance transactions (Financial Assistance Broker Submission) (U.S. Department of the Treasury, USAspending.gov), data current to Oct 8, 2026, loaded Oct 8, 2026 · FY2021–FY2026.
Federal grants & assistanceSubawards under this agency's awards
First-tier subawards that recipients of this agency's contracts and financial assistance reported, by the fiscal year of the subaward.
FY2026
- Sub-contracts: $21.2M (125 subawards)
- Sub-grants: $2.5M (25 subawards)
82 sub-recipients
Largest sub-recipients
- MILWAUKEE, WI · 9 subawards
- P1 CONSTRUCTION LLC$3.9M17%LENEXA, KS · 15 subawards
- TRADE MECHANICAL CONTRACTORS INC$2.7M11%OKLAHOMA CITY, OK · 1 subaward
- CONTROL SERVICE CO INC$1.4M6.1%LEES SUMMIT, MO · 1 subaward
- CL CONSTRUCTION LLC$851.3K3.6%WAHOO, NE · 1 subaward
- TATE ENGINEERING SYSTEMS INC$761.9K3.2%DELMAR, MD · 2 subawards
- ROBERT J HILL$744.9K3.1%WHITE, SD · 1 subaward
- MVP LLC$571.2K2.4%GRANDVIEW, MO · 3 subawards
- SOUTHWEST STEEL FABRICATION LLC$507.4K2.1%BONNER SPRINGS, KS · 5 subawards
- GLOBAL GRAB TECHNOLOGIES, INC.$500.9K2.1%FRANKLIN, TN · 1 subaward
Primes report first-tier subawards of $30,000 or more themselves, and many go unreported (GAO-24-106214). Reporting moved from FSRS to SAM.gov in March 2025 and fewer sub-contracts have been reported since. Amounts are what primes reported; they are never added to prime award totals.
Source: Subawards (first-tier sub-contracts and sub-grants reported under FFATA) (U.S. Department of the Treasury, USAspending.gov (reports filed in SAM.gov, formerly FSRS)), data current to Oct 9, 2026, loaded Oct 9, 2026 · Subawards loaded from FY2021.
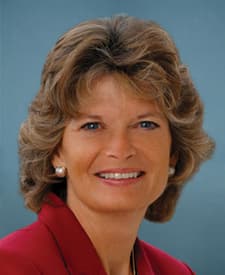
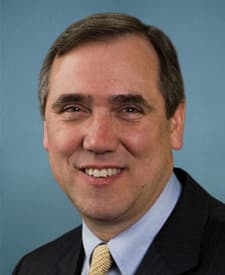
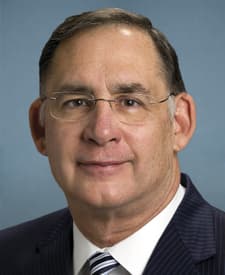
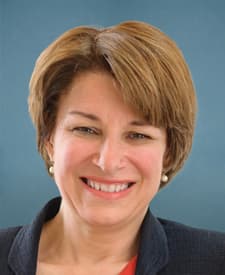
Committees that oversee and fund it
Congressional committees whose jurisdiction includes this agency, and the appropriations subcommittees that write its spending bill (Analisa's reading of the House and Senate rules; committees share jurisdiction). Leaders as currently published.
…
Source: Federal contract transactions (Federal Procurement Data System) (U.S. Department of the Treasury, USAspending.gov), data current to Oct 9, 2026, loaded Oct 9, 2026.